Search for Indicators

Maternal and Infant Health

Mothers and infants are often vulnerable individuals within a population. Therefore, their health and well-being are often one of the strongest indicators of the overall health of a population. To assist you in gauging where Fresno County stands, the indicators are compared to those in California, the United States, and Healthy People 2020. Fresno County has met the Healthy People goal for low birth weight babies, prenatal care, and breastfeeding rates. As of 2015, however, Fresno County has not yet met this goal for preterm birth or infant mortality rates.

Indicator Gauge Icon Legend

Legend Colors

Red is bad, green is good, blue is not statistically different/neutral.

Compared to Distribution

an indicator guage with the arrow in the green 
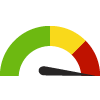
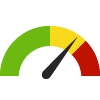
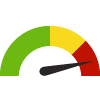
the value is in the best half of communities.

an indicator guage with the arrow in the yellow 
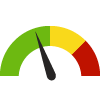
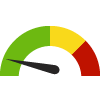
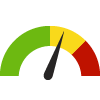
the value is in the 2nd worst quarter of communities.

an indicator guage with the arrow in the red the value is in the worst quarter of communities.

Compared to Target

green circle with white tick inside it meets target; red circle with white cross inside it does not meet target.

Compared to a Single Value

green diamond with downward arrow inside it lower than the comparison value; red diamond with downward arrow inside it higher than the comparison value; blue diamond with downward arrow inside it not statistically different from comparison value.

Trend

green square outline with upward trending arrow inside it green square outline with downward trending arrow inside it non-significant change over time; green square with upward trending arrow inside it green square with downward trending arrow inside it significant change over time; blue square with equals sign no change over time.

Compared to Prior Value

green triangle with upward trending arrow inside it higher than the previous measurement period; green triangle with downward trending arrow inside it lower than the previous measurement period; blue equals sign no statistically different change  from previous measurement period.

More information about the gauges and icons

Preterm Births

Value
Compared to:

Preterm Births

Value
Compared to:

Preterm Births County: Fresno

Current Value:

Preterm Births County: Fresno

10.1%
(2020-2022)
Compared to:
Compared to CA Counties, Fresno has a value of 10.1% which is in the worst 25% of counties. Counties in the best 50% have a value lower than 8.8% while counties in the worst 25% have a value higher than 9.4%.
CA Counties
The distribution is based on data from 58 California counties.
Compared to the CA Value (9.0%), Fresno has a value of 10.1% which is higher and worse.
CA Value
(9.0%)
The regional value is compared to the California state value.
Compared to the prior value, Fresno (10.1%) is not statistically different from the previously measured value (10.2%).
Prior Value
(10.2%)
Prior Value compares a measured value with the previously measured value. Confidence intervals were taken into account in determining the direction of the comparison.
Over time, the Fresno value is staying the same.
Trend
This comparison measures the indicator’s values over multiple time periods.<br>The Mann-Kendall Test for Statistical Significance is used to evaluate the trend<br>over 4 to 10 periods of measure, subject to data availability and comparability.
Compared to the HP 2030 Target (9.4%), the target has not been met.
HP 2030 Target
(9.4%)

Infant Mortality Rate

Value
Compared to:

Infant Mortality Rate

Value
Compared to:

Infant Mortality Rate County: Fresno

Current Value:

Infant Mortality Rate County: Fresno

6.3
Deaths per 1,000 live births
(2017-2019)
Compared to:
Compared to the CA Value (3.9), Fresno has a value of 6.3 which is higher and worse.
CA Value
(3.9)
The regional value is compared to the California state value.
Compared to the US Value (5.7), Fresno has a value of 6.3 which is higher and worse.
US Value
(5.7)
The regional value is compared to the national value. The source for the national value is Centers for Disease Control and Prevention
Compared to the prior value, Fresno (6.3) is not statistically different from the previously measured value (5.9).
Prior Value
(5.9)
Prior Value compares a measured value with the previously measured value. Confidence intervals were taken into account in determining the direction of the comparison.
Over time, the Fresno value is decreasing, not significantly.
Trend
This comparison measures the indicator’s values over multiple time periods.<br>The Mann-Kendall Test for Statistical Significance is used to evaluate the trend<br>over 4 to 10 periods of measure, subject to data availability and comparability.
Compared to the HP 2030 Target (5.0), the target has not been met.
HP 2030 Target
(5.0)
<div>MICH-02: Reduce the rate of infant deaths <strong>(LEADING HEALTH INDICATOR)</strong></div>

Babies with Low Birthweight

Value
Compared to:

Babies with Low Birthweight

Value
Compared to:

Babies with Low Birthweight County: Fresno

Current Value:

Babies with Low Birthweight County: Fresno

7.8%
(2019-2021)
Compared to:
Compared to CA Counties, Fresno has a value of 7.8% which is in the worst 25% of counties. Counties in the best 50% have a value lower than 6.7% while counties in the worst 25% have a value higher than 7.2%.
CA Counties
The distribution is based on data from 56 California counties.
Compared to the CA Value (7.1%), Fresno has a value of 7.8% which is higher and worse.
CA Value
(7.1%)
The regional value is compared to the California state value.
Compared to the US Value (8.5%), Fresno has a value of 7.8% which is lower and better.
US Value
(8.5% in 2021)
The regional value is compared to the national value. The source for the national value is Centers for Disease Control and Prevention
Compared to the prior value, Fresno (7.8%) is not statistically different from the previously measured value (7.6%).
Prior Value
(7.6%)
Prior Value compares a measured value with the previously measured value. Confidence intervals were taken into account in determining the direction of the comparison.
Over time, the Fresno value is decreasing, not significantly.
Trend
This comparison measures the indicator’s values over multiple time periods.<br>The Mann-Kendall Test for Statistical Significance is used to evaluate the trend<br>over 4 to 10 periods of measure, subject to data availability and comparability.

Mothers who Received Early Prenatal Care County: Fresno

Current Value:

Mothers who Received Early Prenatal Care County: Fresno

86.5%
(2019-2021)
Compared to:
Compared to CA Counties, Fresno has a value of 86.5% which is in the best 50% of counties. Counties in the best 50%  have a value higher than 84.8% while counties in the worst 25% have a value lower than 80.3%.
CA Counties
The distribution is based on data from 58 California counties.
Compared to the CA Value (87.9%), Fresno has a value of 86.5% which is lower and worse.
CA Value
(87.9%)
The regional value is compared to the California state value.
Compared to the US Value (78.3%), Fresno has a value of 86.5% which is higher and better.
US Value
(78.3% in 2021)
The regional value is compared to the national value. The source for the national value is Centers for Disease Control and Prevention
Compared to the prior value, Fresno (86.5%) is not statistically different from the previously measured value (85.9%).
Prior Value
(85.9%)
Prior Value compares a measured value with the previously measured value. Confidence intervals were taken into account in determining the direction of the comparison.
Over time, the Fresno value is staying the same.
Trend
This comparison measures the indicator’s values over multiple time periods.<br>The Mann-Kendall Test for Statistical Significance is used to evaluate the trend<br>over 4 to 10 periods of measure, subject to data availability and comparability.

Mothers who Breastfeed

Value
Compared to:

Mothers who Breastfeed

Value
Compared to:

Mothers who Breastfeed County: Fresno

Current Value:

Mothers who Breastfeed County: Fresno

87.2%
(2018-2020)
Compared to:
Compared to CA Counties, Fresno has a value of 87.2% which is in the worst 25% of counties. Counties in the best 50%  have a value higher than 95.1% while counties in the worst 25% have a value lower than 92.8%.
CA Counties
The distribution is based on data from 58 California counties.
Compared to the CA Value (93.8%), Fresno has a value of 87.2% which is lower and worse.
CA Value
(93.8%)
The regional value is compared to the California state value.
Compared to the prior value, Fresno (87.2%) is not statistically different from the previously measured value (88.1%).
Prior Value
(88.1%)
Prior Value compares a measured value with the previously measured value. Confidence intervals were taken into account in determining the direction of the comparison.
Over time, the Fresno value is increasing, not significantly.
Trend
This comparison measures the indicator’s values over multiple time periods.<br>The Mann-Kendall Test for Statistical Significance is used to evaluate the trend<br>over 4 to 10 periods of measure, subject to data availability and comparability.

Teen Birth Rate: 15-19

Value
Compared to:

Teen Birth Rate: 15-19

Value
Compared to:

Teen Birth Rate: 15-19 County: Fresno

Current Value:

Teen Birth Rate: 15-19 County: Fresno

17.3
Live births per 1,000 females aged 15-19
(2019-2021)
Compared to:
Compared to CA Counties, Fresno has a value of 17.3 which is in the 2nd worst quartile of counties. Counties in the best 50% have a value lower than 11.5 while counties in the worst 25% have a value higher than 17.6.
CA Counties
The distribution is based on data from 55 California counties.
Compared to the CA Value (10.3), Fresno has a value of 17.3 which is higher and worse.
CA Value
(10.3)
The regional value is compared to the California state value.
Compared to the US Value (15.2), Fresno has a value of 17.3 which is higher and worse.
US Value
(15.2)
The regional value is compared to the national value. The source for the national value is Centers for Disease Control and Prevention, National Center for Health Statistics
Compared to the prior value, Fresno (17.3) is less and better than the previously measured value (19.4).
Prior Value
(19.4)
Prior Value compares a measured value with the previously measured value. Confidence intervals were taken into account in determining the direction of the comparison.
Over time, the Fresno value is decreasing, significantly.
Trend
This comparison measures the indicator’s values over multiple time periods.<br>The Mann-Kendall Test for Statistical Significance is used to evaluate the trend<br>over 4 to 10 periods of measure, subject to data availability and comparability.