Search for Indicators

Wellness & Chronic Disease

Chronic diseases are defined broadly as conditions that last one year or more and require ongoing medical attention or limit activities of daily living, or both. Six in ten Americans live with at least one chronic disease, such as heart disease, cancer, stroke, asthma, or diabetes. In California, three out of four deaths are due to chronic conditions. Additionally, many Californians have multiple chronic conditions, which limits their ability to exercise or be a member of the workforce, puts them at greater risk for hospitalization, and can lead to an early death. 

Chronic diseases are largely preventable.  Up to 80 percent of cardiovascular disease, stroke, type 2 diabetes, and over 30 percent of cancers could be prevented by eliminating tobacco use, unhealthy diets, physical inactivity, and the harmful use of alcohol.  Promoting community wellness is one way to help reduce the burden of chronic disease in our community.  Wellness programs may include improved and greater access to quality healthcare, greater access to affordable and nutritious food, improved access to low/no cost physical activity opportunities, and improved health policies that protect the community from secondhand smoke and poor air quality. There are many groups in Fresno County who are addressing these issues. Many of these groups work with the Fresno County Health Improvement Partnership (FCHIP) in the form of workgroups such as the Fresno Diabetes Collaborative, Food to Share, Health Literacy, and Land Use and Planning. Contact FCHIP to get involved!

Indicator Gauge Icon Legend

Legend Colors

Red is bad, green is good, blue is not statistically different/neutral.

Compared to Distribution

an indicator guage with the arrow in the green 
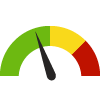
the value is in the best half of communities.

an indicator guage with the arrow in the yellow 
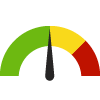
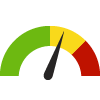
the value is in the 2nd worst quarter of communities.

an indicator guage with the arrow in the red 
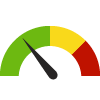
the value is in the worst quarter of communities.

Compared to Target

green circle with white tick inside it meets target; red circle with white cross inside it does not meet target.

Compared to a Single Value

green diamond with downward arrow inside it lower than the comparison value; red diamond with downward arrow inside it higher than the comparison value; blue diamond with downward arrow inside it not statistically different from comparison value.

Trend

green square outline with upward trending arrow inside it green square outline with downward trending arrow inside it non-significant change over time; green square with upward trending arrow inside it green square with downward trending arrow inside it significant change over time; blue square with equals sign no change over time.

Compared to Prior Value

green triangle with upward trending arrow inside it higher than the previous measurement period; green triangle with downward trending arrow inside it lower than the previous measurement period; blue equals sign no statistically different change  from previous measurement period.

More information about the gauges and icons

Self-Reported General Health Assessment: Good or Better County: Fresno

Current Value:

Self-Reported General Health Assessment: Good or Better County: Fresno

84.3%
(2022)
Compared to:
Compared to CA Counties, Fresno has a value of 84.3% which is in the 2nd worst quartile of counties. Counties in the best 50%  have a value higher than 85.5% while counties in the worst 25% have a value lower than 83.8%.
CA Counties
The distribution is based on data from 58 California counties.
Compared to the CA Value (86.0%), Fresno has a value of 84.3% which is lower and worse.
CA Value
(86.0%)
The regional value is compared to the California state value.
Compared to the prior value, Fresno (84.3%) is not statistically different from the previously measured value (86.2%).
Prior Value
(86.2%)
Prior Value compares a measured value with the previously measured value. Confidence intervals were taken into account in determining the direction of the comparison.
Over time, the Fresno value is increasing significantly.
Trend
This comparison measures the indicator’s values over multiple time periods.<br>The Mann-Kendall Test for Statistical Significance is used to evaluate the trend<br>over 4 to 10 periods of measure, subject to data availability and comparability.

Adults with Diabetes

Value
Compared to:

Adults with Diabetes

Value
Compared to:

Adults with Diabetes County: Fresno

Current Value:

Adults with Diabetes County: Fresno

10.8%
(2021-2022)
Compared to:
Compared to CA Counties, Fresno has a value of 10.8% which is in the 2nd worst quartile of counties. Counties in the best 50% have a value lower than 8.9% while counties in the worst 25% have a value higher than 11.9%.
CA Counties
The distribution is based on data from 58 California counties.
Compared to the CA Value (10.7%), Fresno has a value of 10.8% which is higher and worse.
CA Value
(10.7%)
The regional value is compared to the California state value.
Compared to the US Value (11.5%), Fresno has a value of 10.8% which is lower and better.
US Value
(11.5% in 2022)
The regional value is compared to the national value. The source for the national value is Behavioral Risk Factor Surveillance System
Compared to the prior value, Fresno (10.8%) is not statistically different from the previously measured value (12.2%).
Prior Value
(12.2%)
Prior Value compares a measured value with the previously measured value. Confidence intervals were taken into account in determining the direction of the comparison.
Over time, the Fresno value is increasing, not significantly.
Trend
This comparison measures the indicator’s values over multiple time periods.<br>The Mann-Kendall Test for Statistical Significance is used to evaluate the trend<br>over 4 to 10 periods of measure, subject to data availability and comparability.

Adults with Diabetes Census Place: Clovis

Current Value:

Adults with Diabetes Census Place: Clovis

8.9%
(2021)
Compared to:
Compared to CA Census Places, Clovis has a value of 8.9% which is in the best 50% of census places. Census places in the best 50% have a value lower than 10.9% while census places in the worst 25% have a value higher than 12.7%.
CA Census Places
The distribution is based on data from 1,472 locales.
Compared to U.S. Census Places, Clovis has a value of 8.9% which is in the best 50% of census places. Census places in the best 50% have a value lower than 11.0% while census places in the worst 25% have a value higher than 13.1%.
U.S. Census Places
The distribution is based on data from 27,528 U.S. Census Places.
Compared to the US Value (11.3%), Clovis has a value of 8.9% which is lower and better.
US Value
(11.3%)
The regional value is compared to the national value.

Adults with Diabetes Census Place: Fresno

Current Value:

Adults with Diabetes Census Place: Fresno

11.8%
(2021)
Compared to:
Compared to CA Census Places, Fresno has a value of 11.8% which is in the 2nd worst quartile of census places. Census places in the best 50% have a value lower than 10.9% while census places in the worst 25% have a value higher than 12.7%.
CA Census Places
The distribution is based on data from 1,472 locales.
Compared to U.S. Census Places, Fresno has a value of 11.8% which is in the 2nd worst quartile of census places. Census places in the best 50% have a value lower than 11.0% while census places in the worst 25% have a value higher than 13.1%.
U.S. Census Places
The distribution is based on data from 27,528 U.S. Census Places.
Compared to the US Value (11.3%), Fresno has a value of 11.8% which is higher and worse.
US Value
(11.3%)
The regional value is compared to the national value.

Adults with Asthma

Value
Compared to:

Adults with Asthma

Value
Compared to:

Adults with Asthma County: Fresno

Current Value:

Adults with Asthma County: Fresno

19.6%
(2022)
Compared to:
Compared to CA Counties, Fresno has a value of 19.6% which is in the 2nd worst quartile of counties. Counties in the best 50% have a value lower than 17.9% while counties in the worst 25% have a value higher than 20.5%.
CA Counties
The distribution is based on data from 58 California counties.
Compared to the CA Value (17.0%), Fresno has a value of 19.6% which is higher and worse.
CA Value
(17.0%)
The regional value is compared to the California state value.
Compared to the US Value (15.7%), Fresno has a value of 19.6% which is higher and worse.
US Value
(15.7%)
The regional value is compared to the national value. The source for the national value is Behavioral Risk Factor Surveillance System
Compared to the prior value, Fresno (19.6%) is not statistically different from the previously measured value (23.9%).
Prior Value
(23.9%)
Prior Value compares a measured value with the previously measured value. Confidence intervals were taken into account in determining the direction of the comparison.
Over time, the Fresno value is increasing, not significantly.
Trend
This comparison measures the indicator’s values over multiple time periods.<br>The Mann-Kendall Test for Statistical Significance is used to evaluate the trend<br>over 4 to 10 periods of measure, subject to data availability and comparability.

Adults with Current Asthma

Value
Compared to:

Adults with Current Asthma

Value
Compared to:

Adults with Current Asthma County: Fresno

Current Value:

Adults with Current Asthma County: Fresno

9.9%
(2021)
Compared to:
Compared to CA Counties, Fresno has a value of 9.9% which is in the 2nd worst quartile of counties. Counties in the best 50% have a value lower than 9.8% while counties in the worst 25% have a value higher than 10.2%.
CA Counties
The distribution is based on data from 58 California counties.
Compared to U.S. Counties, Fresno has a value of 9.9% which is in the best 50% of counties. Counties in the best 50% have a value lower than 10.2% while counties in the worst 25% have a value higher than 10.8%.
U.S. Counties
The distribution is based on data from 3,074 U.S. counties and county equivalents.
Compared to the US Value (9.7%), Fresno has a value of 9.9% which is higher and worse.
US Value
(9.7%)
The regional value is compared to the national value.

Adults with Current Asthma Census Place: Clovis

Current Value:

Adults with Current Asthma Census Place: Clovis

9.8%
(2021)
Compared to:
Compared to CA Census Places, Clovis has a value of 9.8% which is in the best 50% of census places. Census places in the best 50% have a value lower than 10.0% while census places in the worst 25% have a value higher than 10.5%.
CA Census Places
The distribution is based on data from 1,472 locales.
Compared to U.S. Census Places, Clovis has a value of 9.8% which is in the best 50% of census places. Census places in the best 50% have a value lower than 10.3% while census places in the worst 25% have a value higher than 11.0%.
U.S. Census Places
The distribution is based on data from 27,528 U.S. Census Places.
Compared to the Fresno, CA County Value (9.9%), Clovis has a value of 9.8% which is lower and better.
Fresno, CA County Value
(9.9%)
The regional value is compared to the Fresno County value.
Compared to the US Value (9.7%), Clovis has a value of 9.8% which is higher and worse.
US Value
(9.7%)
The regional value is compared to the national value.

Adults with Current Asthma Census Place: Fresno

Current Value:

Adults with Current Asthma Census Place: Fresno

10.6%
(2021)
Compared to:
Compared to CA Census Places, Fresno has a value of 10.6% which is in the worst 25% of census places. Census places in the best 50% have a value lower than 10.0% while census places in the worst 25% have a value higher than 10.5%.
CA Census Places
The distribution is based on data from 1,472 locales.
Compared to U.S. Census Places, Fresno has a value of 10.6% which is in the 2nd worst quartile of census places. Census places in the best 50% have a value lower than 10.3% while census places in the worst 25% have a value higher than 11.0%.
U.S. Census Places
The distribution is based on data from 27,528 U.S. Census Places.
Compared to the Fresno, CA County Value (9.9%), Fresno has a value of 10.6% which is higher and worse.
Fresno, CA County Value
(9.9%)
The regional value is compared to the Fresno County value.
Compared to the US Value (9.7%), Fresno has a value of 10.6% which is higher and worse.
US Value
(9.7%)
The regional value is compared to the national value.

Adults with Heart Disease

Value
Compared to:

Adults with Heart Disease

Value
Compared to:

Adults with Heart Disease County: Fresno

Current Value:

Adults with Heart Disease County: Fresno

6.5%
(2019-2020)
Compared to:
Compared to the CA Value (6.9%), Fresno has a value of 6.5% which is lower and better.
CA Value
(6.9%)
The regional value is compared to the California state value.
Compared to the prior value, Fresno (6.5%) is not statistically different from the previously measured value (6.7%).
Prior Value
(6.7%)
Prior Value compares a measured value with the previously measured value. Confidence intervals were taken into account in determining the direction of the comparison.
Over time, the Fresno value is decreasing, not significantly.
Trend
This comparison measures the indicator’s values over multiple time periods.<br>The Mann-Kendall Test for Statistical Significance is used to evaluate the trend<br>over 4 to 10 periods of measure, subject to data availability and comparability.

Adults who Experienced Coronary Heart Disease County: Fresno

Current Value:

Adults who Experienced Coronary Heart Disease County: Fresno

5.8%
(2021)
Compared to:
Compared to CA Counties, Fresno has a value of 5.8% which is in the best 50% of counties. Counties in the best 50% have a value lower than 6.0% while counties in the worst 25% have a value higher than 7.3%.
CA Counties
The distribution is based on data from 58 California counties.
Compared to U.S. Counties, Fresno has a value of 5.8% which is in the best 50% of counties. Counties in the best 50% have a value lower than 7.6% while counties in the worst 25% have a value higher than 8.6%.
U.S. Counties
The distribution is based on data from 3,074 U.S. counties and county equivalents.
Compared to the US Value (6.1%), Fresno has a value of 5.8% which is lower and better.
US Value
(6.1%)
The regional value is compared to the national value.

Adults who Experienced Coronary Heart Disease Census Place: Clovis

Current Value:

Adults who Experienced Coronary Heart Disease Census Place: Clovis

4.6%
(2021)
Compared to:
Compared to CA Census Places, Clovis has a value of 4.6% which is in the best 50% of census places. Census places in the best 50% have a value lower than 5.6% while census places in the worst 25% have a value higher than 6.8%.
CA Census Places
The distribution is based on data from 1,472 locales.
Compared to U.S. Census Places, Clovis has a value of 4.6% which is in the best 50% of census places. Census places in the best 50% have a value lower than 6.6% while census places in the worst 25% have a value higher than 7.8%.
U.S. Census Places
The distribution is based on data from 27,528 U.S. Census Places.
Compared to the Fresno, CA County Value (5.8%), Clovis has a value of 4.6% which is lower and better.
Fresno, CA County Value
(5.8%)
The regional value is compared to the Fresno County value.
Compared to the US Value (6.1%), Clovis has a value of 4.6% which is lower and better.
US Value
(6.1%)
The regional value is compared to the national value.

Adults who Experienced Coronary Heart Disease Census Place: Fresno

Current Value:

Adults who Experienced Coronary Heart Disease Census Place: Fresno

5.3%
(2021)
Compared to:
Compared to CA Census Places, Fresno has a value of 5.3% which is in the best 50% of census places. Census places in the best 50% have a value lower than 5.6% while census places in the worst 25% have a value higher than 6.8%.
CA Census Places
The distribution is based on data from 1,472 locales.
Compared to U.S. Census Places, Fresno has a value of 5.3% which is in the best 50% of census places. Census places in the best 50% have a value lower than 6.6% while census places in the worst 25% have a value higher than 7.8%.
U.S. Census Places
The distribution is based on data from 27,528 U.S. Census Places.
Compared to the Fresno, CA County Value (5.8%), Fresno has a value of 5.3% which is lower and better.
Fresno, CA County Value
(5.8%)
The regional value is compared to the Fresno County value.
Compared to the US Value (6.1%), Fresno has a value of 5.3% which is lower and better.
US Value
(6.1%)
The regional value is compared to the national value.

Adults who Experienced a Stroke

Value
Compared to:

Adults who Experienced a Stroke

Value
Compared to:

Adults who Experienced a Stroke County: Fresno

Current Value:

Adults who Experienced a Stroke County: Fresno

3.2%
(2021)
Compared to:
Compared to CA Counties, Fresno has a value of 3.2% which is in the best 50% of counties. Counties in the best 50% have a value lower than 3.2% while counties in the worst 25% have a value higher than 3.7%.
CA Counties
The distribution is based on data from 58 California counties.
Compared to U.S. Counties, Fresno has a value of 3.2% which is in the best 50% of counties. Counties in the best 50% have a value lower than 3.7% while counties in the worst 25% have a value higher than 4.2%.
U.S. Counties
The distribution is based on data from 3,074 U.S. counties and county equivalents.
Compared to the US Value (3.3%), Fresno has a value of 3.2% which is lower and better.
US Value
(3.3%)
The regional value is compared to the national value.

Adults who Experienced a Stroke Census Place: Clovis

Current Value:

Adults who Experienced a Stroke Census Place: Clovis

2.6%
(2021)
Compared to:
Compared to CA Census Places, Clovis has a value of 2.6% which is in the best 50% of census places. Census places in the best 50% have a value lower than 3.0% while census places in the worst 25% have a value higher than 3.6%.
CA Census Places
The distribution is based on data from 1,472 locales.
Compared to U.S. Census Places, Clovis has a value of 2.6% which is in the best 50% of census places. Census places in the best 50% have a value lower than 3.3% while census places in the worst 25% have a value higher than 4.0%.
U.S. Census Places
The distribution is based on data from 27,528 U.S. Census Places.
Compared to the Fresno, CA County Value (3.2%), Clovis has a value of 2.6% which is lower and better.
Fresno, CA County Value
(3.2%)
The regional value is compared to the Fresno County value.
Compared to the US Value (3.3%), Clovis has a value of 2.6% which is lower and better.
US Value
(3.3%)
The regional value is compared to the national value.

Adults who Experienced a Stroke Census Place: Fresno

Current Value:

Adults who Experienced a Stroke Census Place: Fresno

3.1%
(2021)
Compared to:
Compared to CA Census Places, Fresno has a value of 3.1% which is in the 2nd worst quartile of census places. Census places in the best 50% have a value lower than 3.0% while census places in the worst 25% have a value higher than 3.6%.
CA Census Places
The distribution is based on data from 1,472 locales.
Compared to U.S. Census Places, Fresno has a value of 3.1% which is in the best 50% of census places. Census places in the best 50% have a value lower than 3.3% while census places in the worst 25% have a value higher than 4.0%.
U.S. Census Places
The distribution is based on data from 27,528 U.S. Census Places.
Compared to the Fresno, CA County Value (3.2%), Fresno has a value of 3.1% which is lower and better.
Fresno, CA County Value
(3.2%)
The regional value is compared to the Fresno County value.
Compared to the US Value (3.3%), Fresno has a value of 3.1% which is lower and better.
US Value
(3.3%)
The regional value is compared to the national value.

Adults with Cancer

Value
Compared to:

Adults with Cancer

Value
Compared to:

Adults with Cancer County: Fresno

Current Value:

Adults with Cancer County: Fresno

5.4%
(2021)
Compared to:
Compared to CA Counties, Fresno has a value of 5.4% which is in the best 50% of counties. Counties in the best 50% have a value lower than 6.6% while counties in the worst 25% have a value higher than 8.5%.
CA Counties
The distribution is based on data from 58 California counties.
Compared to U.S. Counties, Fresno has a value of 5.4% which is in the best 50% of counties. Counties in the best 50% have a value lower than 7.9% while counties in the worst 25% have a value higher than 8.6%.
U.S. Counties
The distribution is based on data from 3,074 U.S. counties and county equivalents.
Compared to the US Value (7.0%), Fresno has a value of 5.4% which is lower and better.
US Value
(7.0%)
The regional value is compared to the national value.

Adults with Cancer Census Place: Clovis

Current Value:

Adults with Cancer Census Place: Clovis

5.7%
(2021)
Compared to:
Compared to CA Census Places, Clovis has a value of 5.7% which is in the best 50% of census places. Census places in the best 50% have a value lower than 6.6% while census places in the worst 25% have a value higher than 8.1%.
CA Census Places
The distribution is based on data from 1,472 locales.
Compared to U.S. Census Places, Clovis has a value of 5.7% which is in the best 50% of census places. Census places in the best 50% have a value lower than 7.3% while census places in the worst 25% have a value higher than 8.2%.
U.S. Census Places
The distribution is based on data from 27,528 U.S. Census Places.
Compared to the Fresno, CA County Value (5.4%), Clovis has a value of 5.7% which is higher and worse.
Fresno, CA County Value
(5.4%)
The regional value is compared to the Fresno County value.
Compared to the US Value (7.0%), Clovis has a value of 5.7% which is lower and better.
US Value
(7.0%)
The regional value is compared to the national value.

Adults with Cancer Census Place: Fresno

Current Value:

Adults with Cancer Census Place: Fresno

4.8%
(2021)
Compared to:
Compared to CA Census Places, Fresno has a value of 4.8% which is in the best 50% of census places. Census places in the best 50% have a value lower than 6.6% while census places in the worst 25% have a value higher than 8.1%.
CA Census Places
The distribution is based on data from 1,472 locales.
Compared to U.S. Census Places, Fresno has a value of 4.8% which is in the best 50% of census places. Census places in the best 50% have a value lower than 7.3% while census places in the worst 25% have a value higher than 8.2%.
U.S. Census Places
The distribution is based on data from 27,528 U.S. Census Places.
Compared to the Fresno, CA County Value (5.4%), Fresno has a value of 4.8% which is lower and better.
Fresno, CA County Value
(5.4%)
The regional value is compared to the Fresno County value.
Compared to the US Value (7.0%), Fresno has a value of 4.8% which is lower and better.
US Value
(7.0%)
The regional value is compared to the national value.